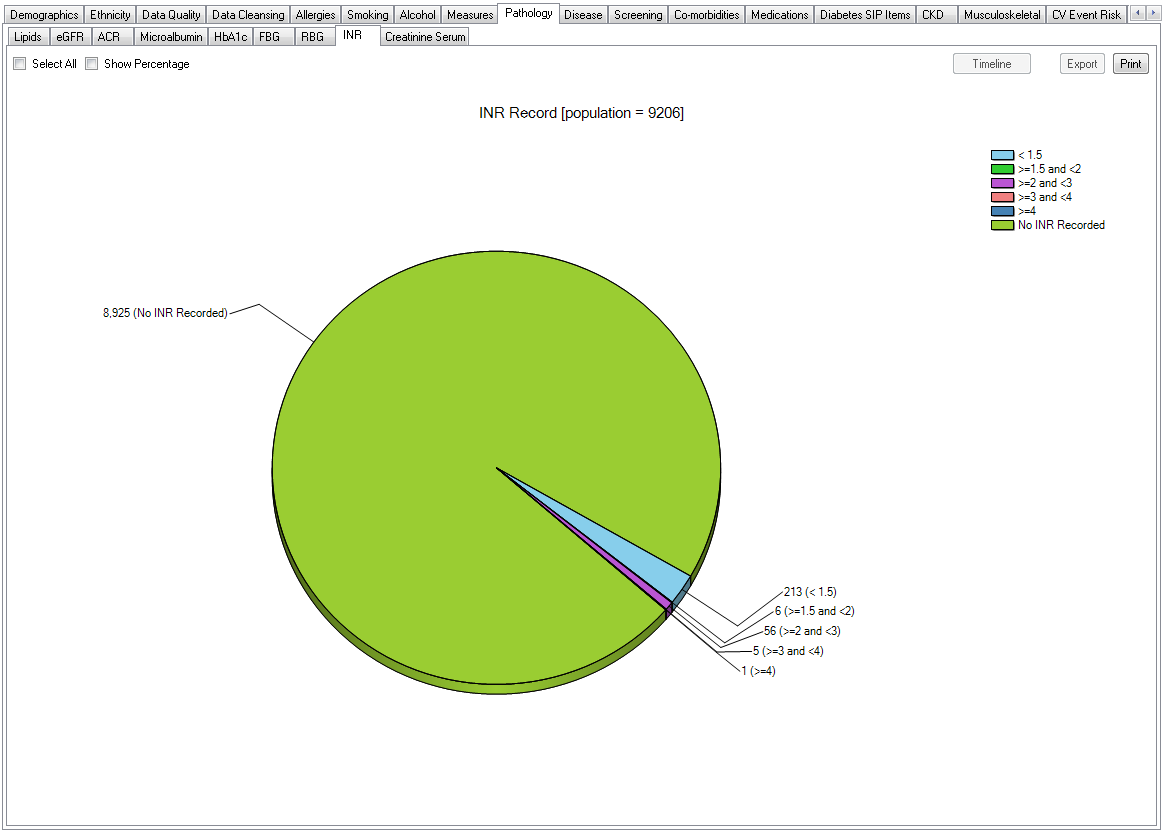
Pathology > INR displays your data as a breakdown of INR status:
- <1.5
- >=1.5-2.0
- >=2.0-3.0
- >=3.0 <4.0
- >=4.0
- No INR Recorded.
The data is displayed as a pie chart. Functions available are as described for Allergies at the beginning of this chapter.
INR Mappings with clinical systems
The INR mappings are provided in the 'General Data Mappings' Appendices under Measurements for each clinical application.