NOTE:
Before you start collecting data sets ensure you have set up your preferences to point to the correct clinical desktop system for your practice. (See 'Setting Your Preferences' for details about how to do this.)
A data set is collected by clicking the 'Collect' button at the top left of the screen.
Once you click the 'Collect' button you will see the 'status bar' in the top right hand corner of the screen flashing while the data is retrieved from the clinical desktop system.
- Genie, practiX, Medinet, Medtech and MMEx users please note that the data collection is performed from within your clinical application. Clicking the CAT4 'Collect' button at the top left of the screen will provide you with the summary steps on how this is done for your system. Step by step details are provided in the Appendices section of the 'PEN CS Clinical Audit Tool 4 User Guide Part 2'.
- Zedmed users please note that to enable CAT4 to extract this data it needs to access the Blobs folder. This folder is used by Zedmed to store HL7 based data. The default location is c:\zedmeddata\blobs but this can vary depending on your installation – to verify the location you can check CRS_App_Server.ini (which may be in a folder called ZedmedServer) which should have an entry called BLOBFilesPath=C:\ZedmedData\Blobs{color}
The data set collected is saved in your preferred data folder (see 'Setting Your Preferences' for more information).
When the data retrieval has completed you will see an entry in the left hand column. The data is stored as a 'snap-shot' on your PC. You can use this 'snap-shot' for analysis at any time in the future.
Tip: To refresh the list of 'snap-shots' toggle the 'hide/view Extracts' button.
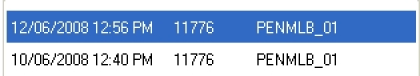
Each entry displays the date/time of collection, the number of records retrieved and the machine name on which the collection was done.
You can collect as many data sets as you wish over time. Each data set will be listed as an entry in the left hand column.
To analyse a specific data set click on the entry for that data set. It will become highlighted and you will see the 'status bar' in the top right hand corner of the screen flashing while the data is reloaded from the 'snap-shot' into Clinical Audit.