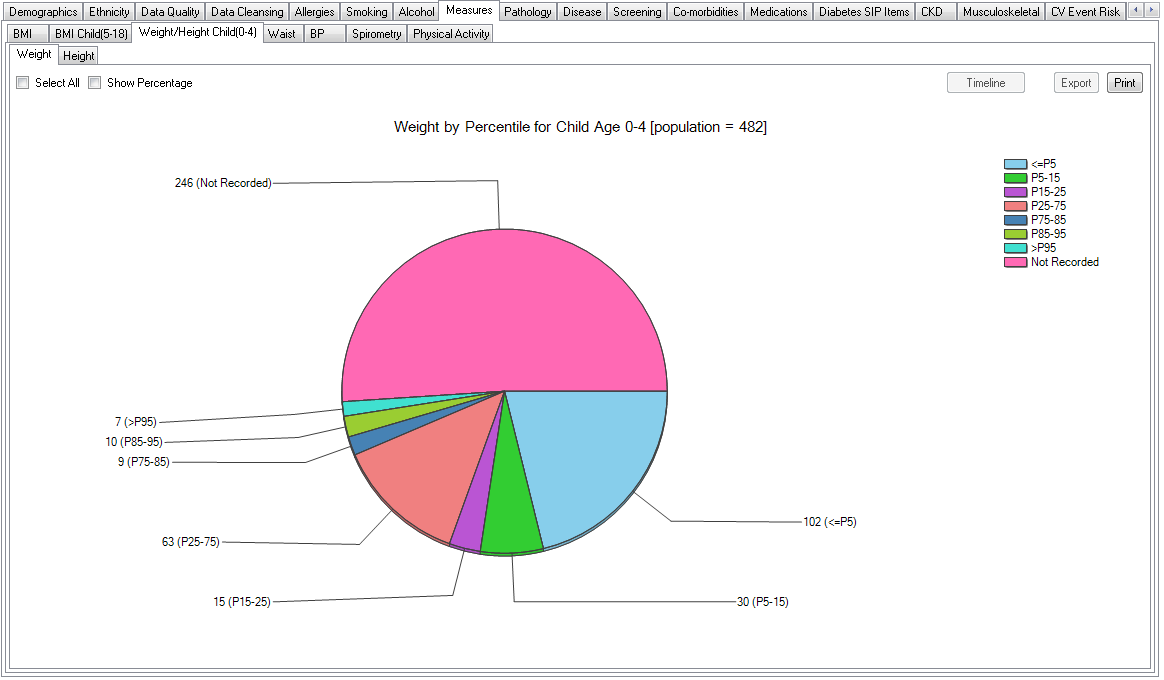
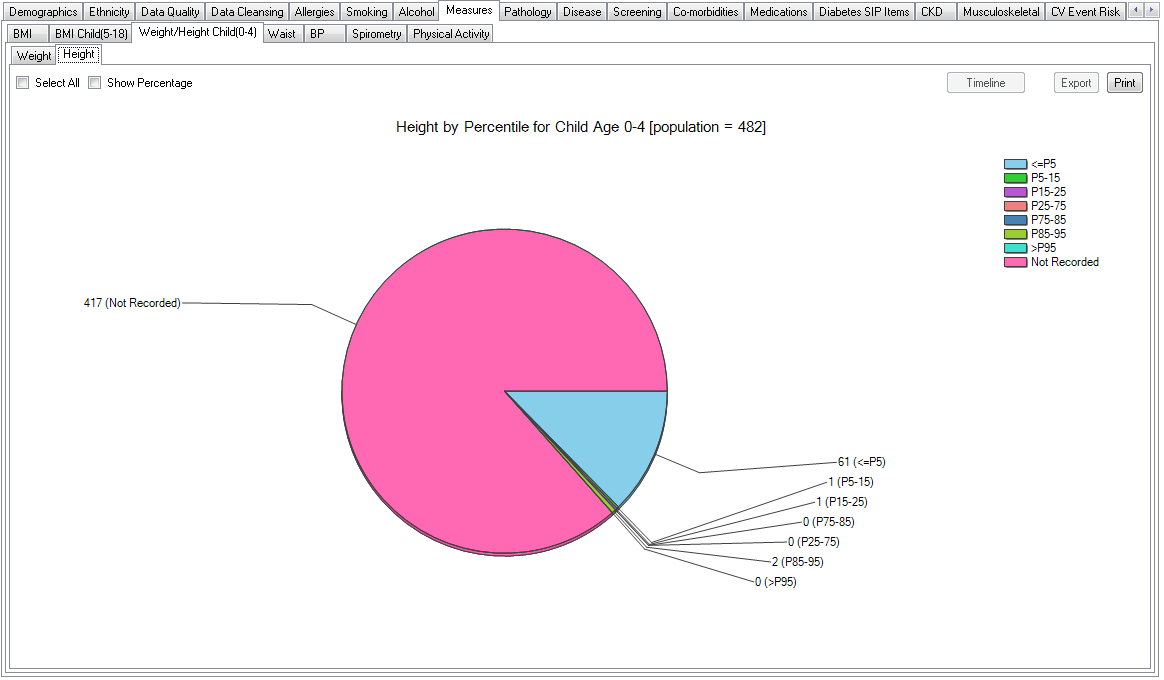
These graphs shows the Weight and Height by percentile for all children aged under 4 years as well as not recorded.
The P in the report stand for percentile. This report enables the user to quickly establish how many children are in which percentile for height/age and weight/age and to identify the children of interest by displaying their details from the report.
The percentiles are displayed in the following ranges:
- <=5P
- P5 -P15
- P15-P25
- P25-P75
- P75-P85
- P85-P75
- >P95