Disease is displayed as a count (the number of patients that have the disease) and the prevalence in the population.
The Disease Prevalence is calculated by identifying the number of patients with a specific disease diagnosis and expressing it as a percentage of the total population.
The disease categories are the same as the conditions provided in the conditions filter (except for some Mental Health Conditions).
The data is displayed as:
- Count per condition in a bar chart
- Prevalence per condition as a percentage of this population in a bar chart
A bar is also provided on the chart for patients that have 'None of these' disease categories. This is provided to assist practices in targeting patients for preventative care and miscoding.
Functions available are as described for Demographics (Bar Chart).
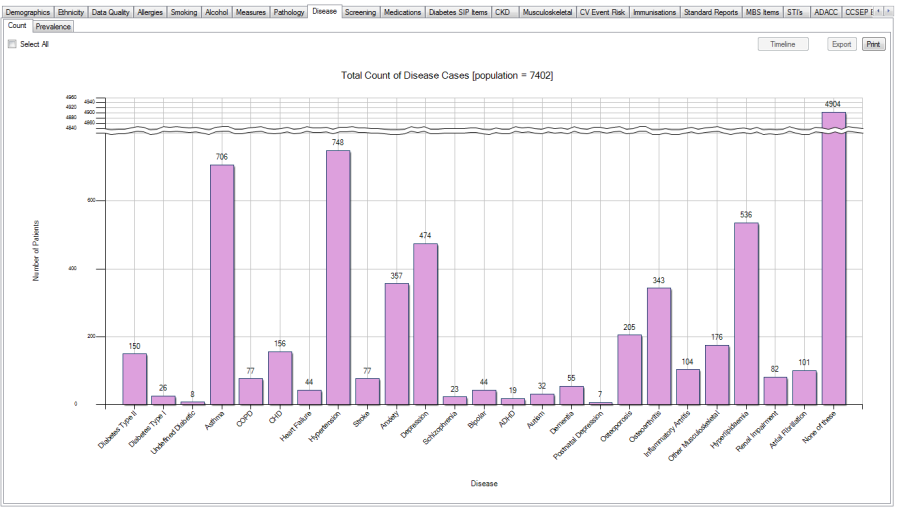
Figure 52: Disease Report