Overview | The CDSA Tool has been developed to report on the completeness of patient demographic and health summary data within the general practice clinical system. It provides the following reports:
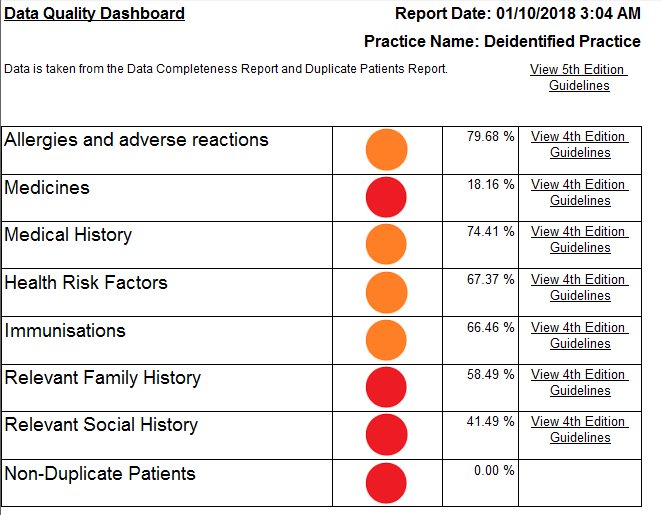
Please note that the percentages shown on the Data Quality Dashboard are an in some cases an average value of the individual indicators. The Allergies and adverse reaction dashboard is a combination of Allergy Status recorded, Coded Allergy recorded and Reaction Completed. Generally speaking the Data Completeness Report will give much more detail than the dashboard and is the recommended report to understand the data quality dashboard.
|
Data | The data indicators are based on the data content outlined in the RACGP data recommendations http://www.racgp.org.au/ehealth/summary
|
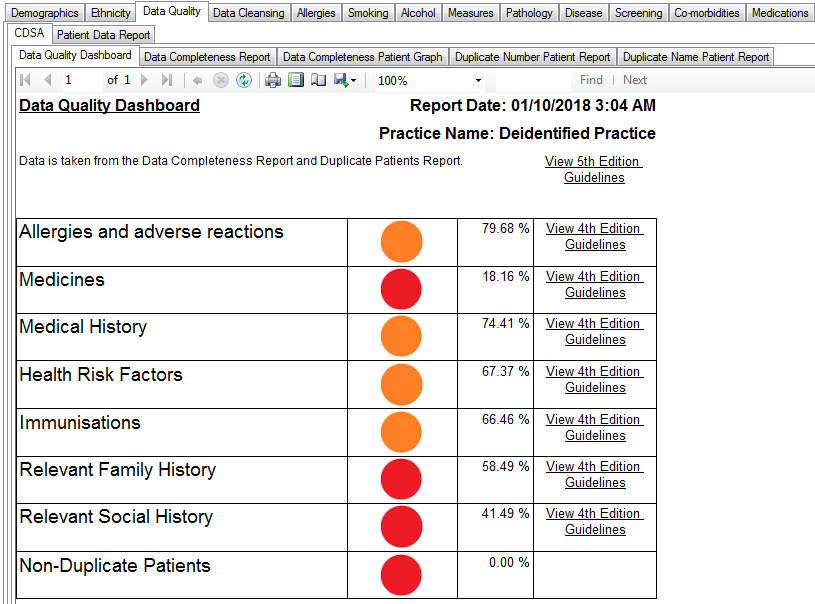
Data Quality Dashboard |
|
Data Quality | The Data Quality Dashboard provides a report indicating the overall status of data quality based on the data indicators. It displays each data content section with a 'Traffic Light' status icon updated fact sheets for the 5th Edition of their guidelines, but the recommendations have not changed.
|
Data Completeness Reports |
|
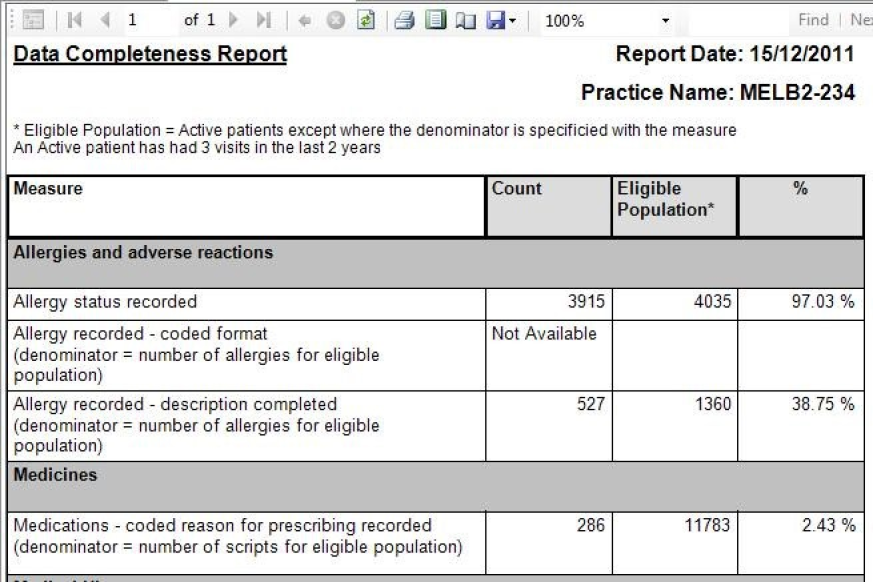
Data Quality | The Completeness Report provides a % of completeness for each data indicator.
|
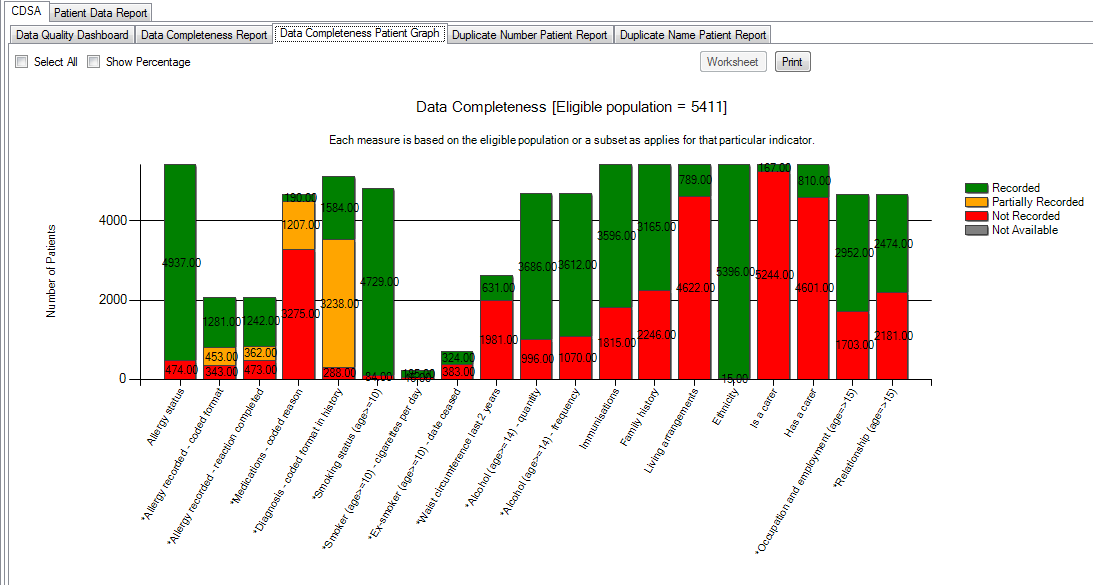
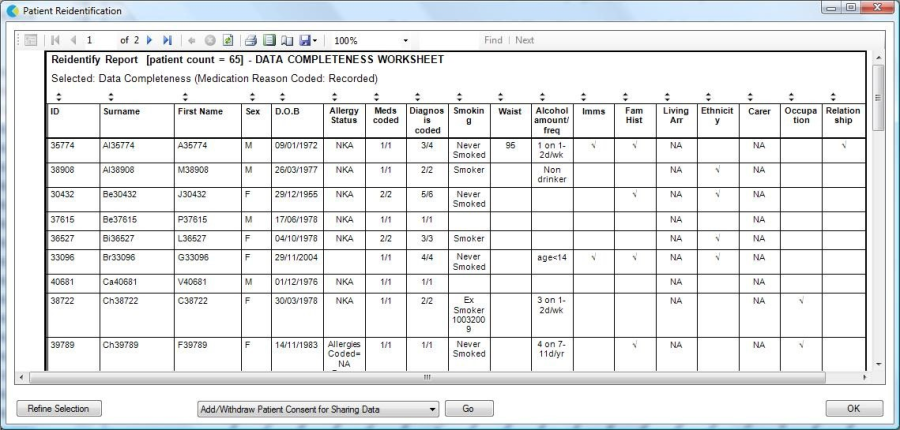
Data Quality | The Completeness graph provides a graphical view of the data indicators by patient and allows re-identification of patients where data is missing.
|
Data | Patient data can be exported from the Data Completeness Graph using the 'Worksheet' button.
|
Duplicate Patients Report |
|
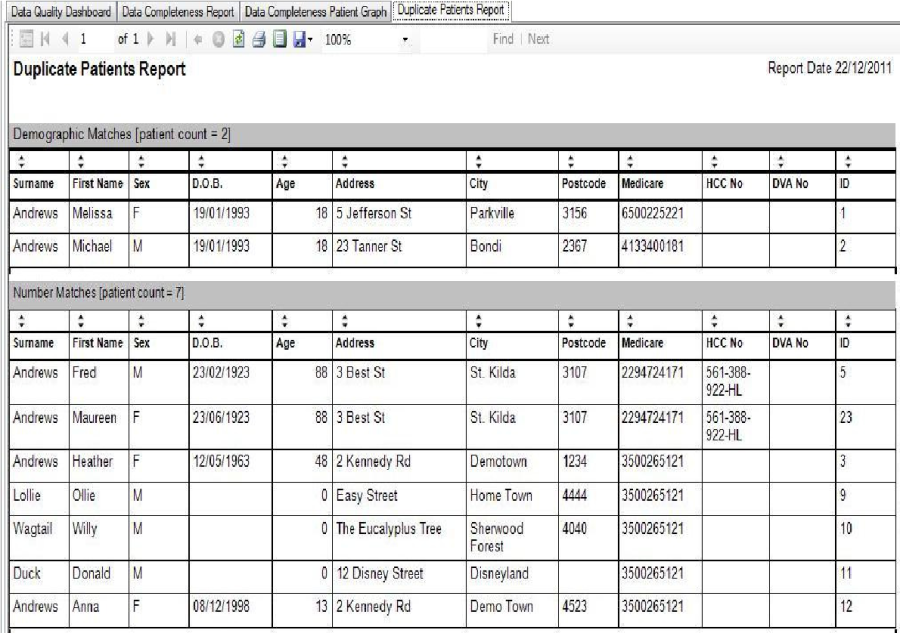
Data Quality > | The Duplicate Patients Report is a list of patient records within the clinical system where duplication is suspected.
|
Appendix A: Data Indicators |
|
|
Indicator | Numerator | Denominator |
1. Allergies and Adverse Reactions |
|
|
Allergy status recorded | Number of patients with an allergy status recorded | Active patients |
Allergy recorded – coded format | Number of allergies recorded that are not NKA from a coded table of available allergens | Number of allergies for active patients recorded that are not NKA |
Allergy recorded – reaction completed | Number of allergies recorded that are not NKA that have content in the reaction field | Number of allergies for active patients recorded that are not NKA |
2. Medicines |
|
|
Medications – coded reason for prescribing | Number of prescriptions for current medications in active patients where the reason for prescribing is recorded from a coded pick list | Number of prescriptions for current medications recorded for active patients |
3. Medical History |
|
|
Diagnosis recorded – coded format in past history | Number of diagnoses entered in the past history which have been entered in a coded format | Number of diagnoses recorded in the past history for active patients |
4. Health Risk Factors |
|
|
Smoking status recorded | Number of active patients 10 years and over for whom smoking status is recorded | Active patients 10 years and over |
Smoker – Cigarettes per day recorded | Number of active patients 10 years and over recorded as smokers for whom the number | Active patients 10 years and over recorded as smokers |
Ex-smoker – Date ceased | Number of active patients 10 years and over recorded as ex-smokers for whom a cease | Active patients 10 years and over recorded as ex-smokers |
Waist circumference recorded in overweight/underweight patients | Number of active patients for whom a waist circumference is recorded within the last 2 years | Active patients who are overweight (BMI ≥ 25) or underweight (BMI < 18.5) |
Alcohol Status – quantity recorded | Number of active patients 14 years and over who have alcohol quantity recorded | Active patients 14 years and over |
Alcohol Status – frequency recorded | Number of active patients 14 years and over who have alcohol frequency recorded | Active patients 14 years and over |
5. Immunisations |
|
|
Immunisations recorded Active patients |
| Active patients |
6. Relevant Family History |
|
|
Family history recorded | Active patients with family history recorded in the system | Active patients |
7. Relevant Social History |
|
|
Living arrangement recorded | Active patients with living arrangements recorded | Active patients |
Ethnicity recorded | Active patients with ethnicity recorded | Active patients |
Is a carer recorded | Active patients with 'Is carer' recorded | Active patients |
Has a carer recorded | Active patients with 'has a carer' field recorded | Active patients |
Occupation and employment status recorded | Active patients with occupation and employment status field recorded | Active patients 15 years and over |
Relationship status recorded | Active patients with relationship status field recorded | Active patients 15 years and over |
8. Duplicate Patients |
|
|
Duplicate Patients | Patients who have a match on any of the following: | Total Population |
Appendix B: Indicator unavailability by |
|
Medical | The following indicators are not available for collection from Medical Director: Allergy recorded – coded format Living arrangement recorded Is a carer recorded |
Best Practice | All indicators are available |
Medinet | The following indicators are not available for collection from Medinet: |