Skip to main content
assistive.skiplink.to.breadcrumbs
assistive.skiplink.to.header.menu
assistive.skiplink.to.action.menu
assistive.skiplink.to.quick.search
Log in
Help / Tips
Help
Online Help
Keyboard Shortcuts
Feed Builder
What’s new
Available Gadgets
About Confluence
Search
Home
Quick Search
Hit enter to search
CAT GUIDES
Content
Pages
Blog
Space Tools
Settings
Content Tools
3080240
CG
3
A
t
tachments (9)
Page History
Page Information
Resolved comments
View in Hierarchy
View Source
Export to PDF
Export to Word
Pages
…
CAT4 User Guide
ANALYSING A DATA SET
Reports and Graphs
STANDARD REPORTS
Indicator Sets
National KPI Report
NKPI Report Graphs
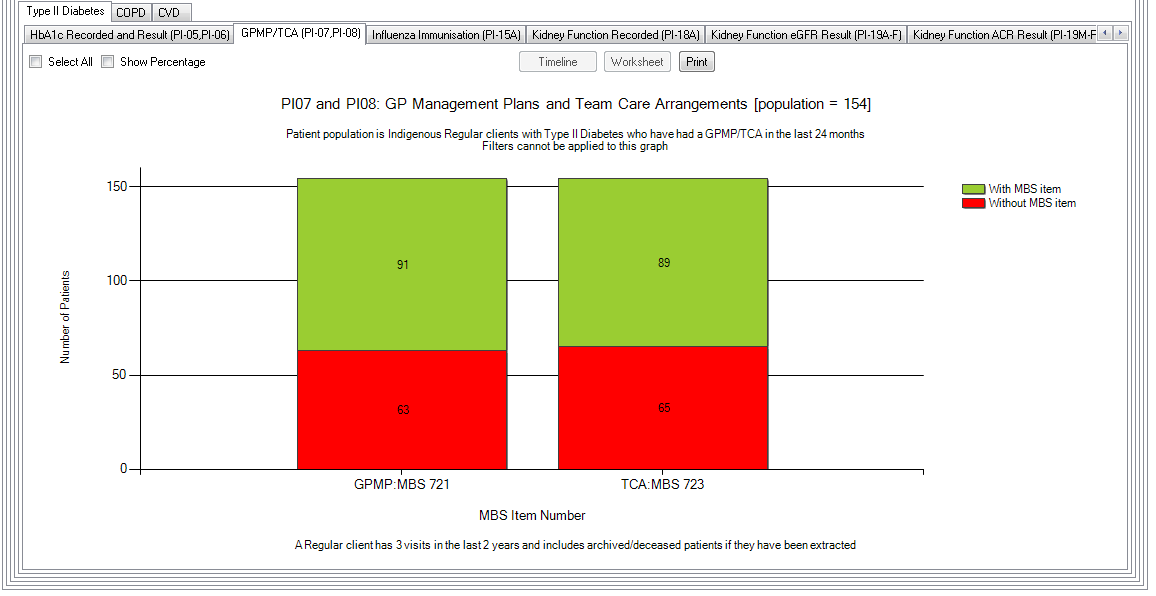
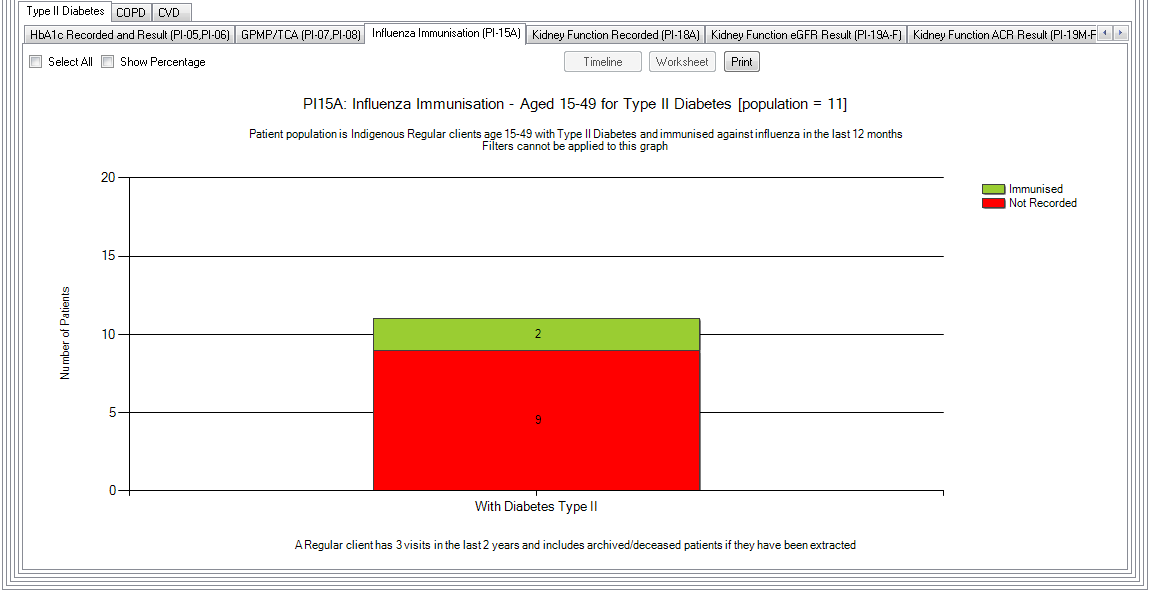
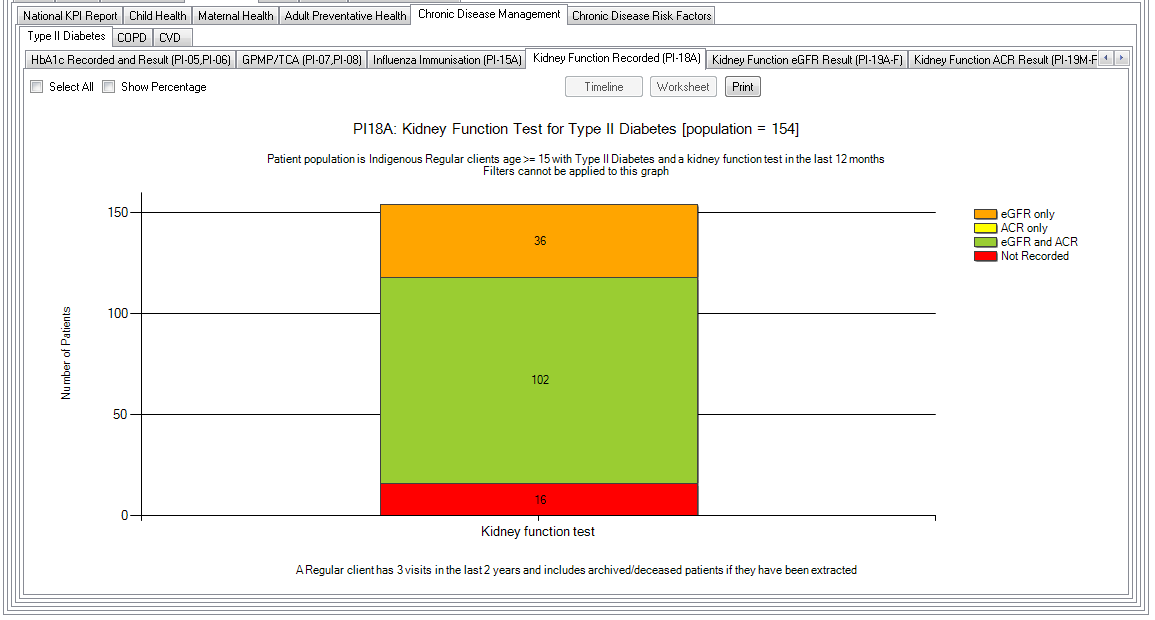
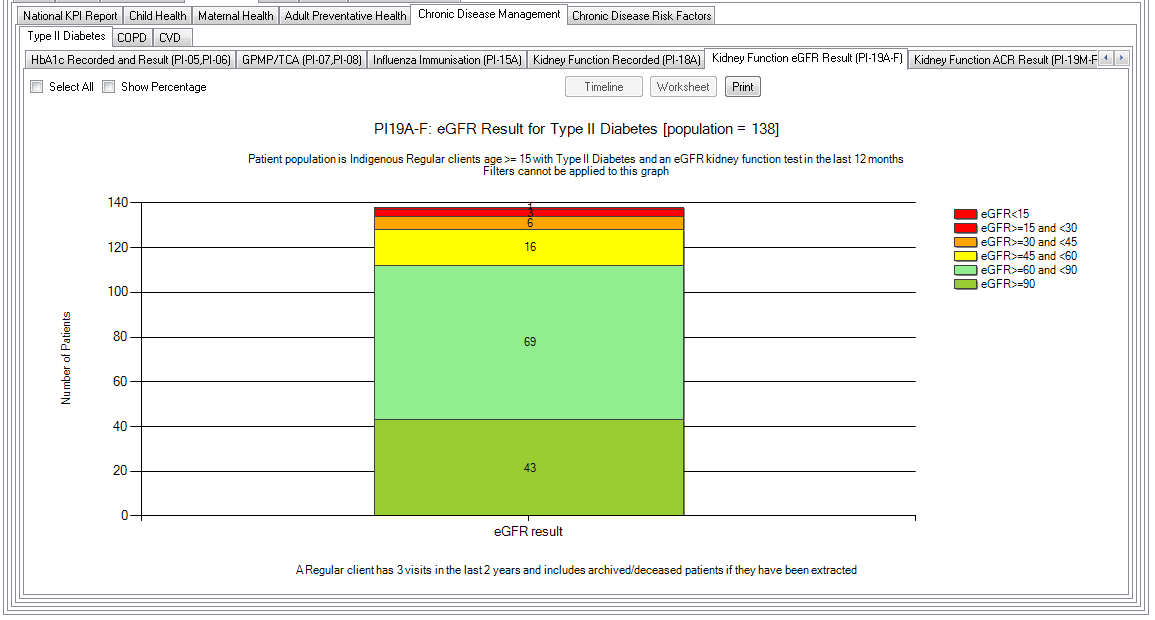
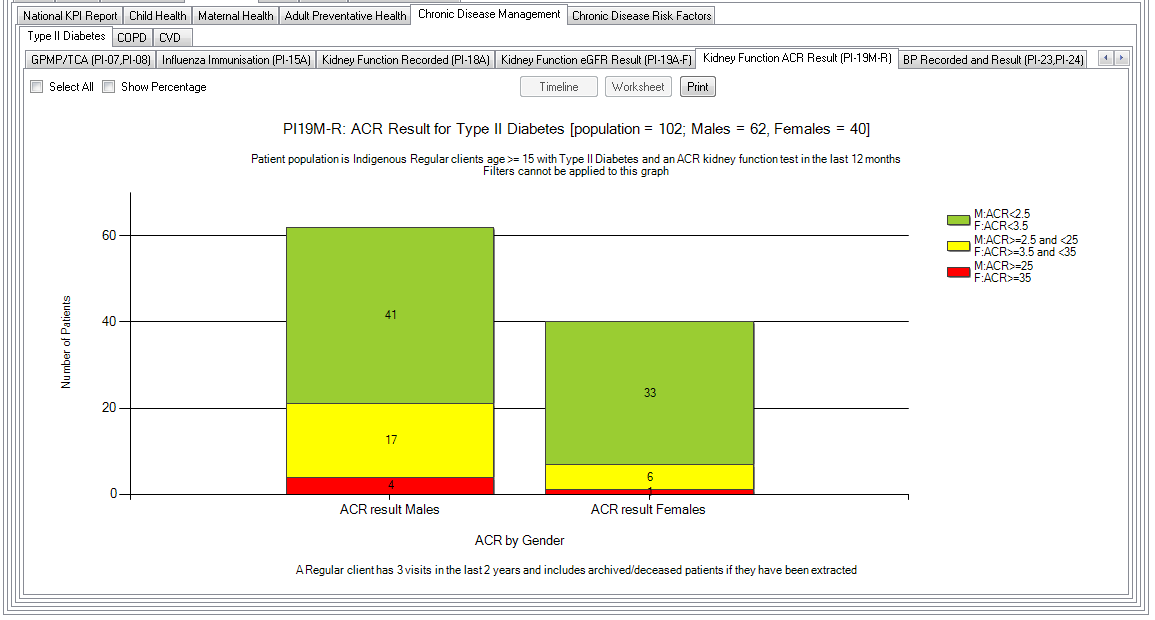
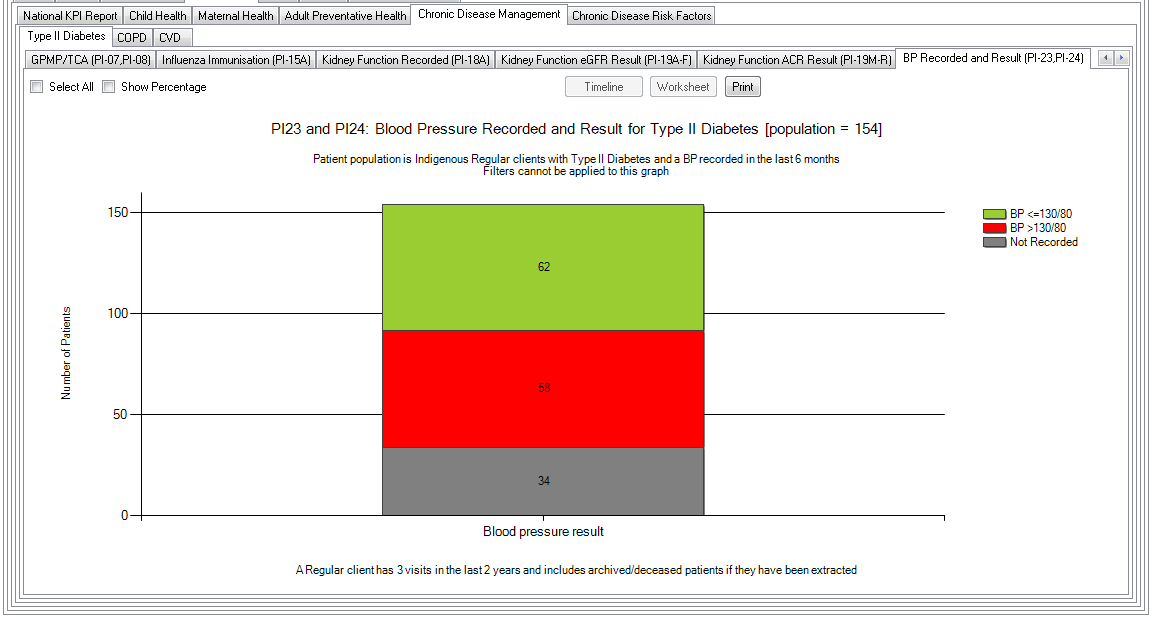
Chronic Disease Management
Skip to end of banner
Jira links
Go to start of banner
Type II Diabetes Graphs
Created by
user-529d4
, last modified on
25 Sep, 2016
null