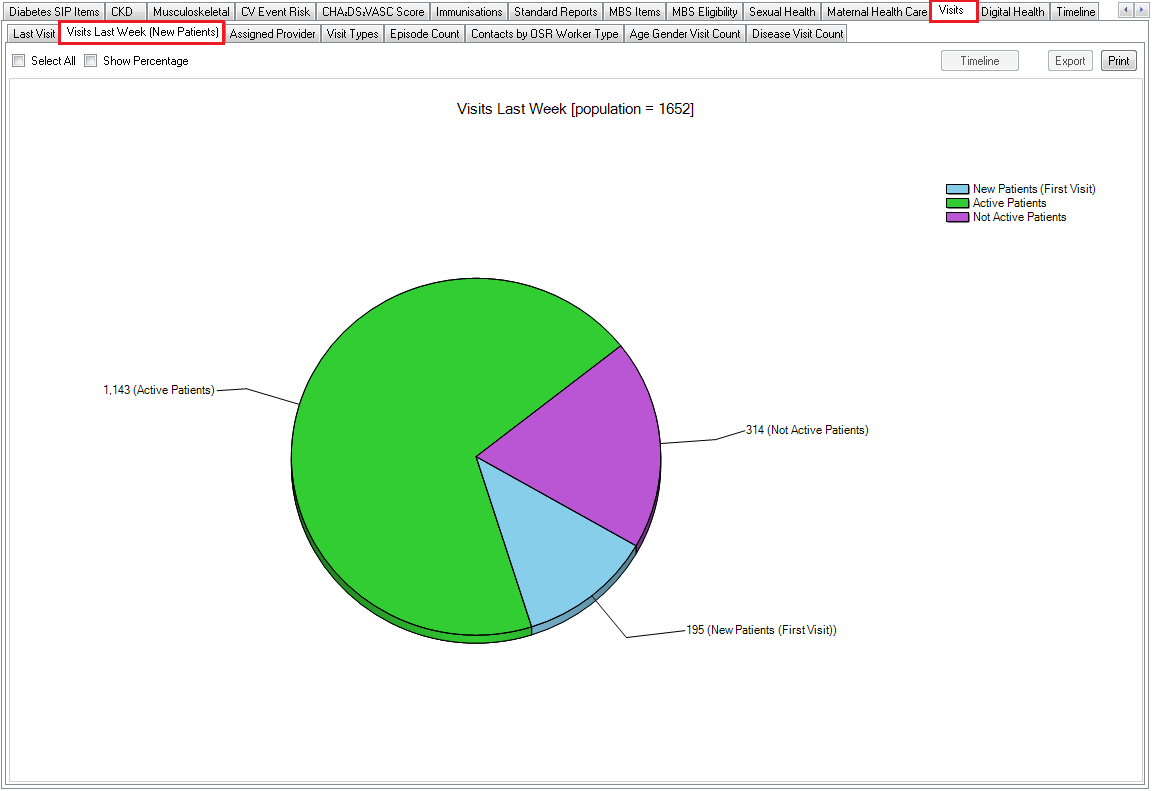
This tab shows a pie chart of patients who have had their first visit in the last week, active patients (3 visits in the last 2 years) and Not Active patients (less than 3 visits in the last 2 years).
This tab shows a pie chart of patients who have had their first visit in the last week, active patients (3 visits in the last 2 years) and Not Active patients (less than 3 visits in the last 2 years).