Data filtering enables viewing graphs and reports based on specific criteria. The data filters are organised into a series of tabs:
- General (Demographics including Health Cover and DVA status)
- Ethnicity
- Conditions
- Medications
- Date Range (Results)
- Date Range (Visits)
- Patient Name
- Patient Status
- Providers
- Risk Factors
- Health Care Homes Filter (if participating in the trial)
- Custom Filters
Another tab is provided for you to save a specific set of filter criteria:
Saved Filters
To filter the data, simply select the criteria you wish to view. This is generally done by ticking selection boxes, however some filters are based on entering information such as a Postcode or Suburb. The criteria on which you are filtering is displayed at the top of the Results panel, this display remains even if the Filter panel is hidden.
Click 'Recalculate'.
You will see the 'status bar' in the top right hand corner of the screen flashing while the filtered data is reloaded from the 'snapshot' into CAT4. This will update to Results panel to look at only patients that match all the conditions ticked.
Example:
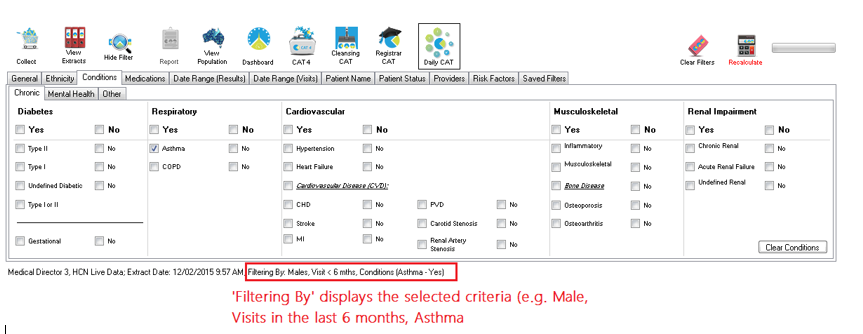
Examples for each of the filter types are provided in the following sections.